Official transaction study · 2026-08
Monthly condo and apartment resale report: 2026-08
How many private non-landed resales were recorded by project in 2026-08?
First published 6 Sep 2026. Content updated 6 Sep 2026, 18:09 +08. Current content version eaf32d0481132725cc58a49c. Automated descriptive analysis.
767 matching recorded transactions
98 observations appear in 15 reported groups. 669 observations are withheld from small groups. Each displayed group contains at least five transactions.
Observed months: 2026-08 to 2026-08.
Recorded transactions
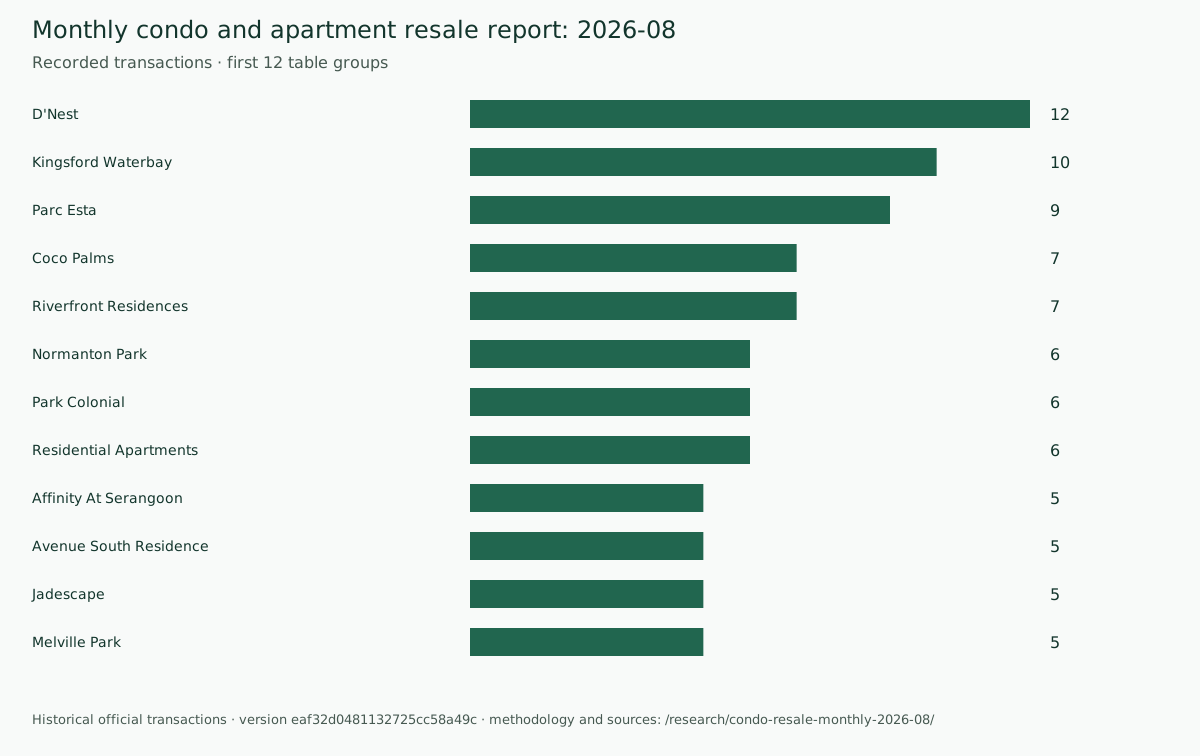
First 12 groups in table order. Bars share a zero baseline; full results and exact aggregates are below.
| Recorded sales | Project | Area 25th percentile (m²) | Area 75th percentile (m²) | Median area (m²) | Median price (S$) |
|---|---|---|---|---|---|
| 12 | D'Nest | 70.0 | 90.0 | 87.0 | 1,395,944 |
| 10 | Kingsford Waterbay | 49.0 | 87.5 | 63.0 | 984,000 |
| 9 | Parc Esta | 67.0 | 78.0 | 69.0 | 1,725,000 |
| 7 | Coco Palms | 76.5 | 132.5 | 116.0 | 1,740,018 |
| 7 | Riverfront Residences | 45.5 | 73.5 | 57.0 | 1,060,000 |
| 6 | Normanton Park | 81.0 | 90.0 | 88.5 | 1,915,000 |
| 6 | Park Colonial | 46.2 | 61.2 | 57.5 | 1,370,000 |
| 6 | Residential Apartments | 105.0 | 126.8 | 113.0 | 1,701,000 |
| 5 | Affinity At Serangoon | 50.0 | 68.0 | 50.0 | 900,000 |
| 5 | Avenue South Residence | 61.0 | 64.0 | 61.0 | 1,390,000 |
| 5 | Jadescape | 71.0 | 107.0 | 71.0 | 1,730,000 |
| 5 | Melville Park | 89.0 | 93.0 | 92.0 | 930,000 |
| 5 | Reflections at Keppel Bay | 144.0 | 177.0 | 167.0 | 3,000,000 |
| 5 | The Tapestry | 44.0 | 92.0 | 86.0 | 1,715,000 |
| 5 | Treasure At Tampines | 63.0 | 94.0 | 85.0 | 1,600,000 |
Displayed prices are rounded to whole dollars and areas to one decimal place. Download the CSV for exact calculated values.
Method
Use active non-synthetic official single-unit strata resale observations for the stated period, restricted to public property identities. Preserve repeated source observations. Group only by the named dimensions. Suppress every group below five transactions. Count observations and calculate median total price and area, and area quartiles, with linear interpolation of sorted observations. No mix adjustment is applied.
What these results cannot tell you
These records are historical transactions, not available inventory. Raw groups differ in lease, floor, size, condition and property mix; differences do not establish causation or investment returns. Source coverage and reporting lags can change counts. The current month may be incomplete, and even a completed calendar month can receive later records. No inference about unsold homes or publication-time availability is supported. Repeated source observations are preserved; this is not a count of unique homes. A dated report retains its cited snapshot version until explicitly refreshed; a newer source generation may contain corrections.
Source coverage and snapshots
URA private residential transactions · Urban Redevelopment Authority
Official dataset documentation · Licence. Source: URA. Transaction records are subject to corrections and rolling five-year coverage.
Snapshot retrieved 2026-09-06T04:10:41.317123+00:00. Source period 2021-08 to 2026-08. 133,642 rows in the whole source snapshot (not the study sample). Scope: nationwide. Source publication timestamp is not supplied.
Snapshot 49e29c50-c7e1-40ed-9bc6-7b064eaced5d · checksum 30bdf440a1ca0475dc0a83cda3a852f531830b0112e425efdc1527a38c1da114
Cite this analysis
Monthly condo and apartment resale report: 2026-08. Property Upside automated descriptive analysis, version eaf32d0481132725cc58a49c. Link to this page and attribute the underlying government dataset separately. The source snapshot IDs and downloaded aggregates identify the inputs and results for this version.